When you are running a certain campaign on your WordPress website, it’s super important to monitor how it performs and make some adjustments to maximize the results.
You can use a tool like Google Analytics to monitor the traffic of the page being boosted for the campaign.
The problem with Google Analytics is that it is not built specifically for WordPress. It takes extra effort to setup the integration and requires a learning curve to read the reports. Especially for beginners.
There is an easier approach that you can use to monitor the traffic of a certain page in WordPress and I will cover it in this post.
Shortcuts ⤵️
- When should you check the traffic?
- Key metrics to look for
- Plugins to check the traffic stats
- Checking the traffic stats using Independent Analytics
- Summary
When Should You Check the Traffic Stats of a Page?
The most logical scenario where you should check and monitor the traffic of a page on your WordPress website is when you are running a paid campaign on Meta Ads (or other advertising platforms).
Oftentimes, the numbers shown on the Meta Ads dashboard don’t align with what really happened.
I often encounter a situation where Meta Ads shows a high number of clicks while in reality, the number of page visits is far below what Meta Ads shows.
There are many factors affecting this, of course. From page speed to bots.
The point is, you should have your own mechanism to monitor the traffic of your page when you are running a paid campaign on Meta Ads instead of just relying on the reports from Meta Ads.
Another scenario where checking the traffic stats of a page is crucial is when you want to monetize its traffic. By understanding the metrics of the page (geographic, devices, etc), you can make an offer that is likely to have a better conversion.
Remember. High traffic is good, but targeted traffic is better.
Here are some scenarios where you should monitor the traffic of a page on your WordPress site:
- When you are running paid ads
- When you are running a collaboration
- When you want to monetize site traffic
- When you are testing link placement
Key Metrics You Need to Look for
A good campaign is one that has a clear goal. And to achieve the goal, you need to be able to read the reporting data correctly before making adjustments.
For instance, if the landing page being boosted has a short session duration, you can try a different angle on your copy to make it more appealing so that those who view it can stay longer.
Some analytics plugins have the ability to track lick licks. If possible, you can use an analytics plugin that has this feature so that you can monitor the click rate on your landing page more effortlessly.
Here are some metrics you need to look for when monitoring the traffic stats of a page:
- Number of visitors
- Number of views
- Bounce rate
- Session duration
- Geographic/location
Useful WordPress Plugins to Check the Traffic Stats of a Specific Page
Before you can monitor the traffic stats of a specific page on your WordPress website, you need to install an analytics plugin.
You can also use Google Analytics, of course. But again, Google Analytics is not built specifically for WordPress and it requires a learning curve to read the data.
Not to mention the site performance issue due to external files it loads.
There are tons of free analytics plugins that you can use to monitor the traffic on your site. Be it the traffic of an entire site or the traffic of a specific page.
Here are some of the best ones that I recommend. All plugins on the list don’t require any configuration to use.
Once installed and activated, they will start to work and you can start to read the reporting data once the data is sufficiently collected.
| Free version is available | Ability to create a custom report | |
|---|---|---|
| Independent Analytics | ✅ | ✅ |
| WP Statistics | ✅ | ✅ |
| Burst Statistics | ✅ | ✅ |
| Jetpack Stats | ✅ | ✅ |
| AnalyticsWP | ❌ | ✅ |
| SlimStat | ✅ | ✅ |
Checking the Traffic Stats of a Page Using Independent Analytics
All plugins on the table above are great to replace Google Analytics to track the traffic of your website or a specific page on your website.
But for the purpose of this tutorial, I will use Independent Analytics. I prefer Independent Analytics because it’s extremely easy to use. Especially for beginners.
All of its core features are available for free, including the filtering feature that you will need to check the traffic stats of a specific page.
Installing and Activating the Independent Analytics Plugin
Independent Analytics is a freemium plugin. Meaning that there are two versions available: the free version and pro version.
The free version of Independent Analytics is available on the WordPress plugin repository, while the pro version is available on its official website.
Since the free version of Independent Analytics is available on WordPress plugin repository, you can install it directly from your WordPress dashboard.
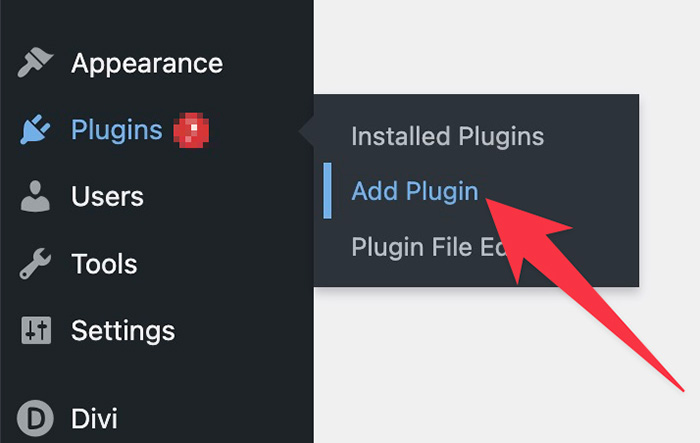
To install it, first, login to your WordPress dashboard and go to Plugins -> Add Plugin.
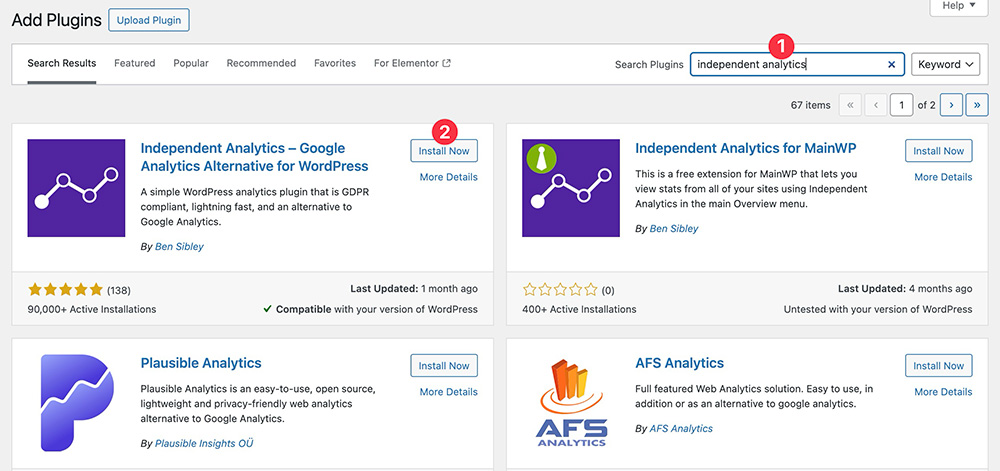
Type “independent analytics” on the search box to find the plugin and click the Install Now button to install it on your WordPress site.
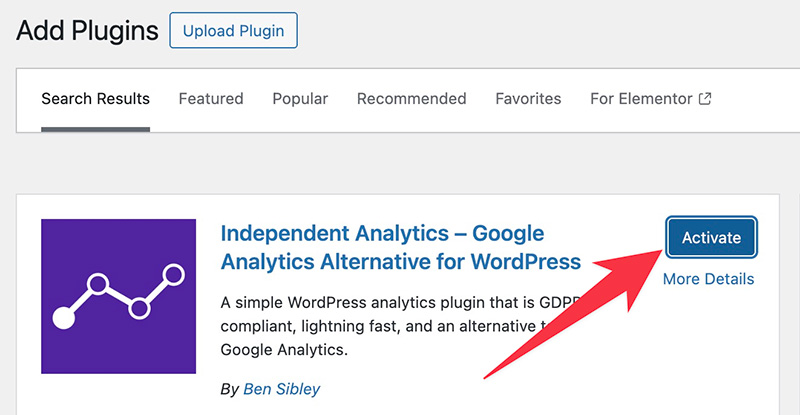
Wait a moment while WordPress is installing the plugin. Once done, you can click the Activate button to activate the plugin.
Independent Analytics will start to work immediately after being activated. No extra configuration is needed.
But keep in mind that it takes time for it to collect the data from the fresh installation. You will start to see the traffic stats on your website after 24 hours from the moment the plugin was activated.
Accessing the Traffic Stats Reports
After activating the Independent Analytics plugin, you can see a new item called Analytics on the menu panel inside your WordPress dashboard. Clicking the menu will take you to the reporting screen where you can see the traffic stats of your website.
But again, you will only see the stats after Independent Analytics has enough data to show (usually after 24 hours).
From the main reporting screen, you can check stats like total number of visitors, total number of views, bounce rate, average session duration, and so on.
In the chart section, you can monitor the daily stats on your website.
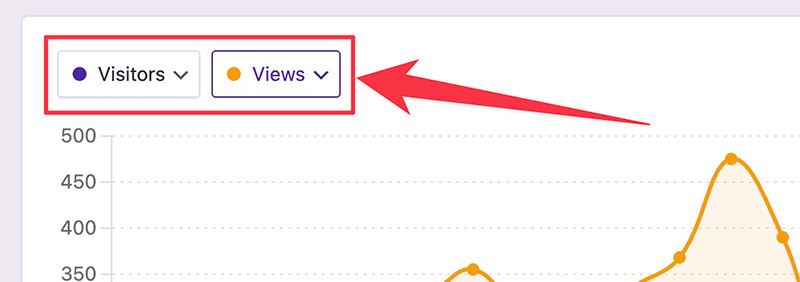
By default, the chart displays the number of visitors and views, but you can change it as per your needs.
Here are the metrics you can display on the chart:
- Number of visitors
- Number of page views
- Number of clicks
- Session duration
- Average session duration
- Number of views per session
- Number of form submissions (supports some form builders)
To change the default metrics displayed on the chart, you can simply pick the metrics you want from the dropdowns.
Creating a Custom Report to Check the Stats of a Specific Page
Beneath the chart on the main reporting screen of Independent Analytics, you can see the popular pages on your website — complete the stats. From here, you can check the stats of a specific page on your WordPress site.
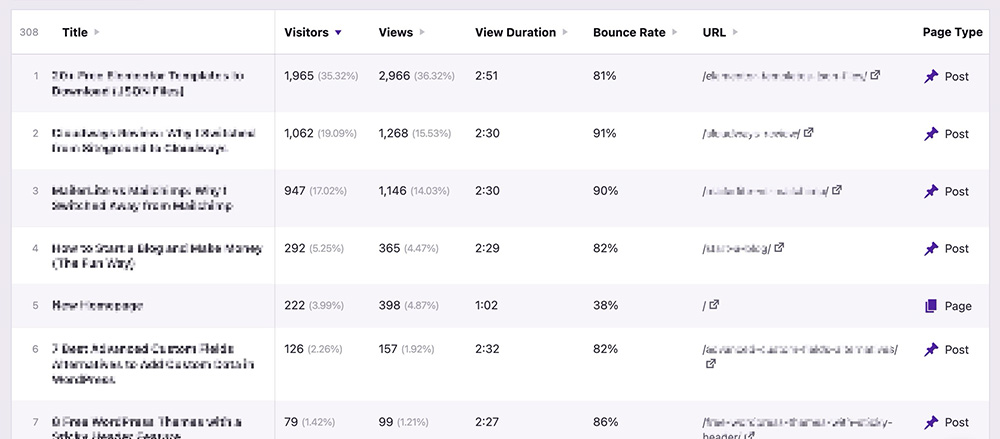
What if the page you want to monitor the traffic of is not available on the list?
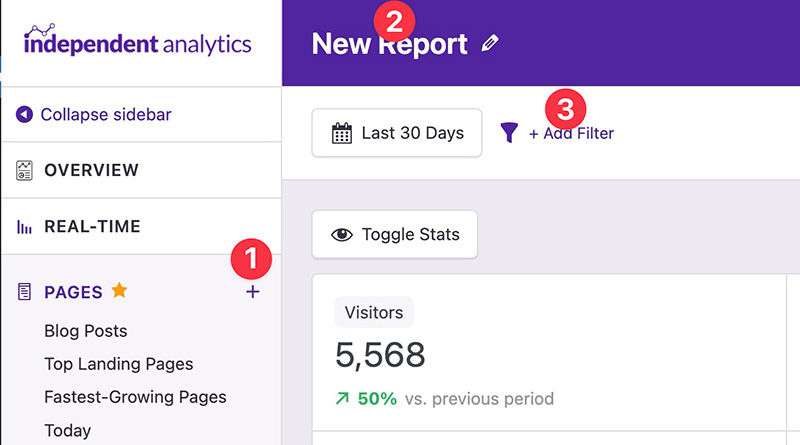
Independent Analytics has a feature to create a custom report. You can use it to create a custom report of the page you want to check the traffic stats of.
To create a custom report for a specific page in Independent Analytics, you can click the plus icon on the PAGES section on the Independent Analytics menu panel. Give your report a title and click Add Filter to add filtering parameters
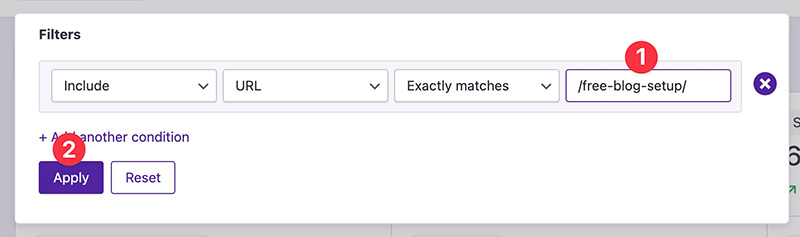
There are several parameters that you can use to filter the pages. If you truly want to create a custom report for a specific page, you can use either Title or URL. In this post, I use URL.
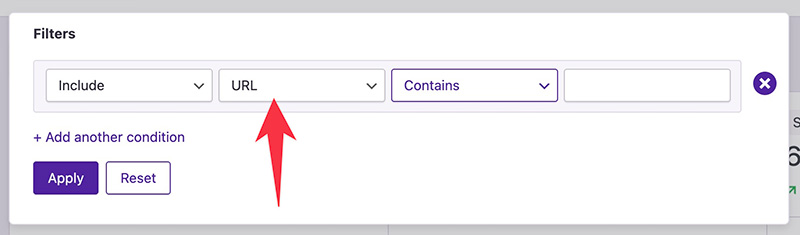
After selecting a filtering parameter, you can pick a condition. There are two conditions you can set: Contains and Exactly matches. For a more precise filtering, you can use the latter condition.
Paste the slug of the URL and click the Apply button.
After clicking the Apply button, Independent Analytics will only display the stats of a specific page (the one you filter) on the chart.
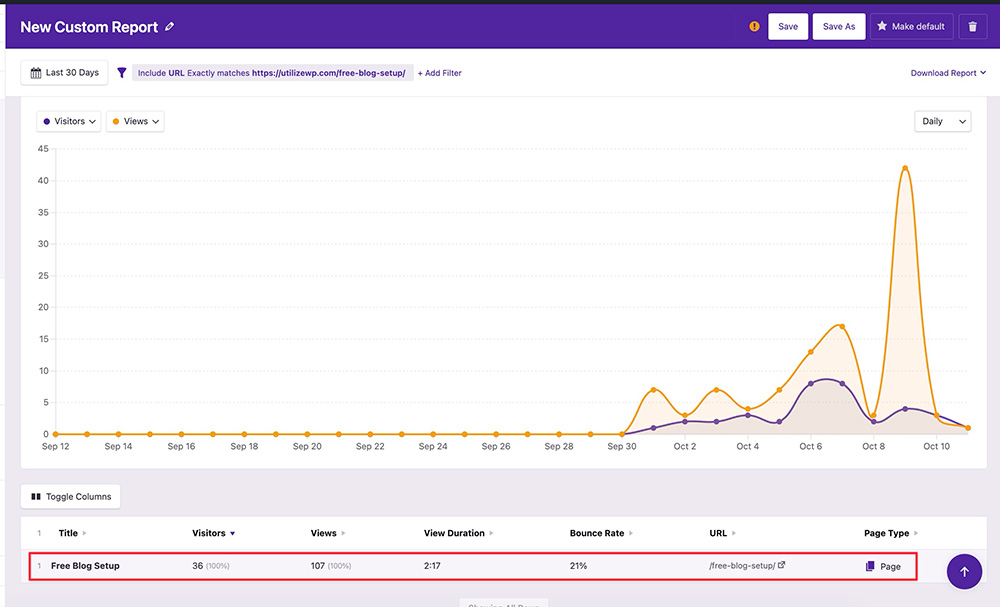
Click the Save button to save the custom report.
In the future, if you want to access the custom report you have just created, you can go to the Independent Analytics reporting screen and click the label of your custom report on the menu panel.
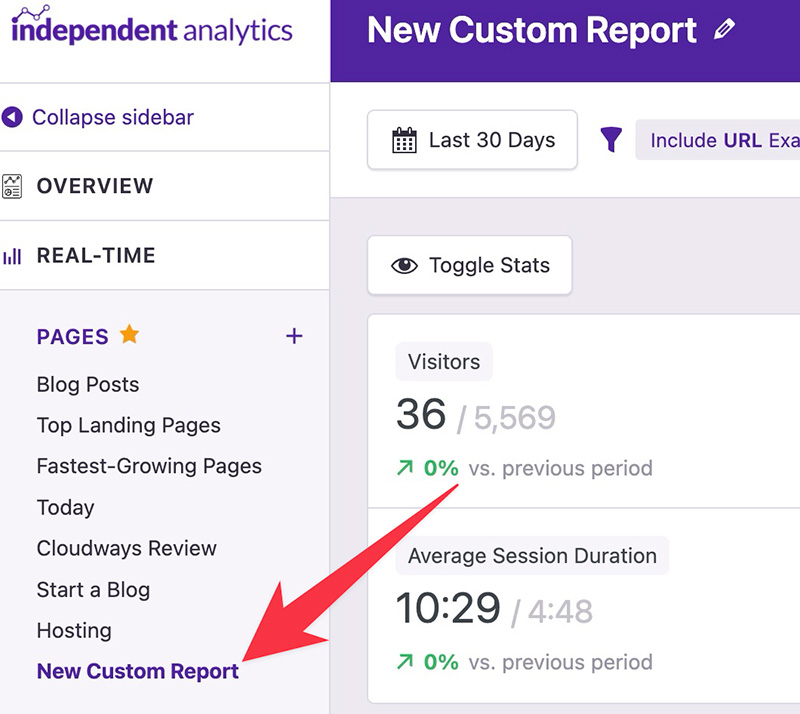
For a quick access to the custom report, you can also add a shortcut to the WordPress admin bar if you want.
A little information.
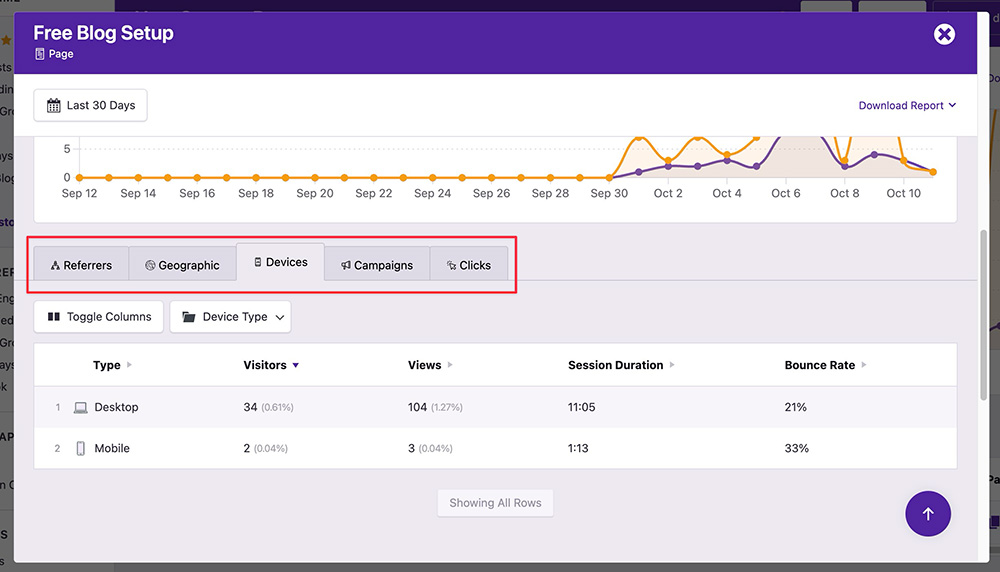
If you use the pro version of Independent Analytics, you can access advanced data like geographic, devices, referrer, and campaign. To access it, you can click the magnifying glass icon next to the page title.
After clicking the icon above, a new window will show up. You can access the advanced data beneath the chart on the appearing window.
Summary 📝
It’s extremely crucial to monitor the traffic stats of a page when you are running a campaign. Especially a paid campaign on Meta Ads and the likes.
You need to monitor the crucial metrics, especially the number of clicks, because what Meta Ads shows don’t always match reality.
Independent Analytics is a great plugin to monitor your site’s traffic. It has a feature to create a custom report for a specific page, which is super useful when you are running a paid campaign.
You can use Independent Analytics to monitor metrics like the number of visitors, the number of views, the number of clicks, and so on. You can use it for free. A pro version is available if you want to access more advanced data.
You can learn more about Independent Analytics and download it from their website:


